
Grip Strength as a Percentage of Body Weight: Why It’s a Key Health Indicator
Oct 19, 2026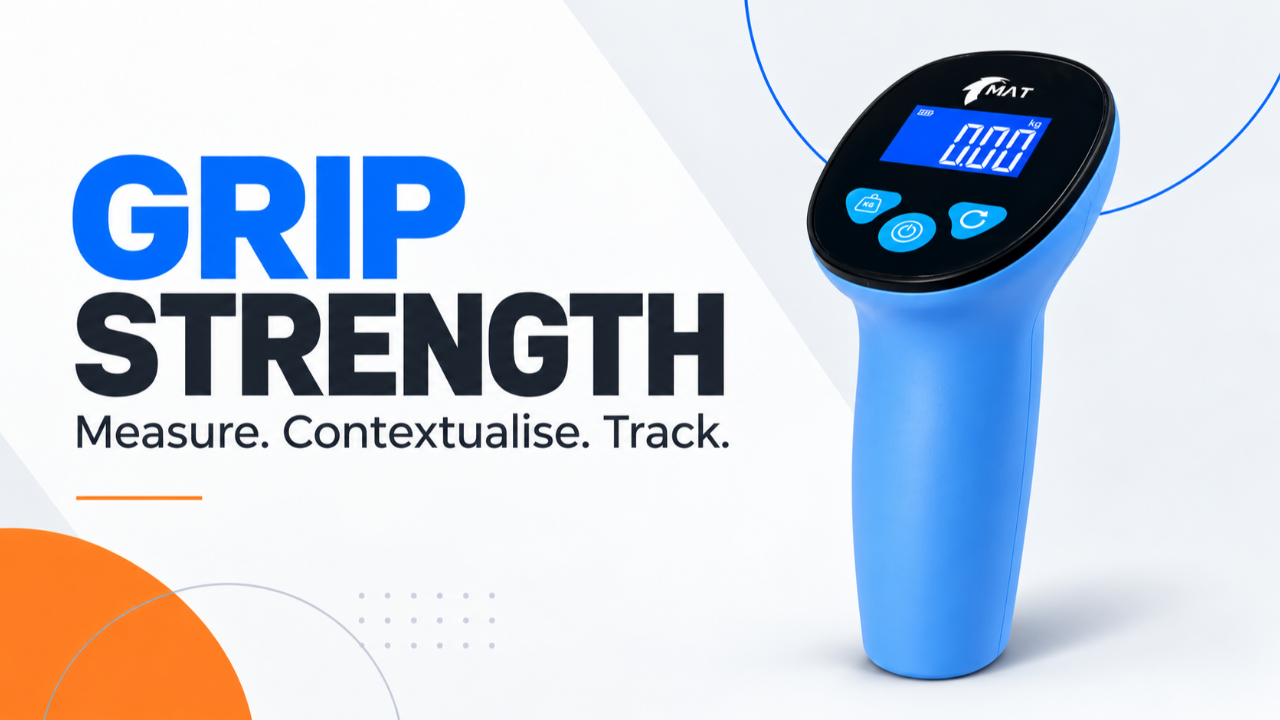
Grip strength is a simple, practical way to measure hand strength and build an objective picture of physical capacity. Comparing results with appropriate population reference values and tracking them over time makes the assessment more useful for everyday activity, work and performance.
Relative grip strength, expressed as a percentage of body weight (%BW), can complement absolute grip strength. Recording both measures helps describe strength in kilograms and in relation to body mass.
Grip strength (%BW) = grip reading in kg ÷ body weight in kg × 100. Here, “kg” refers to the kilogram-force reading commonly displayed by dynamometers. Use a clearly defined single-hand or maximum-hand result; do not compare a sum of both hands with single-hand reference data.
Dividing by body weight puts strength in relation to mass, but does not directly measure or fully adjust for body composition. The ratio can change because grip strength changes, body weight changes, or both.
A Practical Starting Benchmark in Measurz
In Measurz, we use grip strength of approximately 30–40% of body weight as an initial coaching benchmark to guide client conversations and goal-setting. This is a MAT practice guideline. Individual goals reflect age, sex, starting capacity and activity demands: some clients may use it as a first milestone, while others will already exceed it and benefit from a higher target.
Healthy-Population Data Provide Context
Stotz, Hamacher and Zech (2023) studied 69 healthy, independently living older adults. The 34 women (mean age 76.5 years) averaged 37% BW grip strength (SD 7 percentage points); the 35 men (mean age 76.8 years) averaged 48% BW (SD 10 percentage points). Thus, a value within the 30–40% band was observed as the average in this older female sample.
These descriptive findings provide context for the benchmark, rather than validating a minimum for every client. The study used a Saehan SH5001 dynamometer, standing with the elbow at 90°, and the maximum of two trials. Its results are not MAT Gripper-specific norms. Use consistent testing and appropriate population references to personalise goals.
Grip Strength as % Body Weight: Using Population Norms
Population reference values help place a grip result alongside those of people of the same age and sex. A percentile describes position within the reference population: the 50th percentile is the median, with half of results above and half below it. A median is a useful comparison point, rather than a minimum everyone needs to achieve.
Body-Weight-Specific Reference Data
Soumaré et al. (2026; online 2025) reported age- and sex-specific percentiles from 18,532 French adults aged 18–91, including grip relative to body weight. Separate dominant- and non-dominant-hand values allow comparisons using the appropriate hand and protocol.
These are population-specific references. Before assigning a %BW percentile, consult the original table for the person's age, sex and tested hand. A ratio of 0.50 kg/kg equals 50% BW; it does not mean the 50th percentile.
Absolute and Height-Normalised Norms
Dodds et al. (2014) provide British age- and sex-specific absolute-strength centiles. Tomkinson et al. (2025) provide international adult percentiles for absolute strength and grip divided by height squared. These complement body-weight ratios, using a different approach to account for body size.
Choose a reference that fits the assessment. General-population datasets may include people with health conditions; they should not be described as exclusively healthy samples. For a strictly healthy-population comparison, check the source's eligibility criteria. Keep the units and testing method consistent when interpreting any reference.
Why This Matters
A Clear Baseline for Progress
Recording grip strength provides an objective starting point for conversations about strength, work, sport and everyday tasks. Age- and sex-matched percentiles add context, while repeat measurements show how the individual is progressing.
Personalised Goals
Combine population comparisons with the person's activities, training experience and goals. Track the absolute reading, body weight and %BW together so changes in strength can be distinguished from changes in body mass.
Real-World Case Example
A 45-year-old male, body weight 85 kg, records a peak grip strength of 42 kg.
-
Absolute grip strength: 42 kg
-
Relative grip strength: 42 ÷ 85 × 100 = 49.4% BW
The 42 kg reading and 49.4% BW ratio provide a clear baseline for future assessments. Compare the absolute result with a suitable male, age-matched reference using a compatible protocol. For a %BW percentile, use a body-weight-specific reference; height would also be needed to use the 2025 height-normalised norms.
Key insight:
Record both values, then interpret them alongside testing conditions, task demands and previous measurements. This supports clear goal-setting and consistent progress tracking.
Using Grip Strength Data Effectively
-
Use a calibrated dynamometer and a consistent protocol. Document device, handle setting, posture, hand tested, repetitions, rest and whether the reported result is a maximum or average.
-
Match your reference protocol. The 2025 international norms were harmonised to a seated hydraulic-dynamometer test with a flexed elbow, neutral forearm, handle adjusted to hand size, three trials per hand and the maximum result.
-
Track absolute strength and body weight separately as well as %BW. A higher ratio after weight loss does not necessarily mean grip strength improved.
-
Assess change against measurement variability and the person's clinical context. Cross-sectional age centiles are not a forecast of an individual's rate of decline.
Make objective assessment part of the conversation. Use consistent measurements, appropriate reference data and repeat assessments to support informed decisions about health, work and performance.
Why Devices and Grip Design Matter
Commonly used research dynamometers, including Jamar and Smedley models, have designs that differ from the MAT Gripper. Differences in device style, handle size, shape, grip span or diameter, and measurement mechanism can influence the recorded result. Device differences can therefore contribute to variation between studies, alongside the population and testing protocol.
McDowell et al. (2012) compared Jamar-style and cylindrical handles in a small laboratory study and found that handle size significantly affected measured grip strength. Guerra et al. (2017) found that the curved-handle Bodygrip produced readings closer to Jamar than its straight-handle version, highlighting the importance of handle ergonomics.
For useful comparisons: record the device and protocol, keep them consistent during follow-up, and choose reference data from a comparable assessment. These studies did not test the MAT Gripper, so they do not establish the size or direction of any difference from it, or a conversion factor for published norms.
Key References
-
Dodds RM et al. (2014). Grip Strength across the Life Course: Normative Data from Twelve British Studies. PLOS ONE, 9(12), e113637. doi:10.1371/journal.pone.0113637. Primary pooled population study.
-
Tomkinson GR et al. (2025). International norms for adult handgrip strength: A systematic review of data on 2.4 million adults aged 20 to 100+ years from 69 countries and regions. Journal of Sport and Health Science, 14, 101014. doi:10.1016/j.jshs.2024.101014. Systematic review and normative synthesis; first published online in December 2024.
-
Soumaré A et al. (2026; first online 3 October 2025). Handgrip strength reference values and determinants of muscle weakness in French adults: results from the NutriNet-Santé study. The Journal of Sports Medicine and Physical Fitness, 66(1), 22–31. doi:10.23736/S0022-4707.25.16833-3.
-
McDowell TW, Wimer BM, Welcome DE, Warren C, Dong RG. (2012). Effects of handle size and shape on measured grip strength. International Journal of Industrial Ergonomics, 42(2), 199–205. doi:10.1016/j.ergon.2012.01.004.
-
Guerra RS et al. (2017). Comparison of Jamar and Bodygrip Dynamometers for Handgrip Strength Measurement. Journal of Strength and Conditioning Research, 31(7), 1931–1940.
-
Stotz A, Hamacher D, Zech A. (2023). Relationship between Muscle Strength and Gait Parameters in Healthy Older Women and Men. International Journal of Environmental Research and Public Health, 20(7), 5362. doi:10.3390/ijerph20075362. See Table 1.
Download Our Measurz App For FREE And Perform, Record and Track 800+ Tests With Your Clients Today.
Want To Improve Your Assessment?
Not Sure If The MAT Data-Driven Approach Is Right For You?
Get a taste of our MAT Course and data-driven approach using the MAT with a FREE module from our online MAT Course.
We hate SPAM. We will never sell your information, for any reason.


